




Visualize your data for better decisions and insights

We help you and your clients think more clearly and make better decisions. Our language is visual, and it takes many forms: data visualizations, dashboards, prototypes, Figma boards, mockups, report templates, and infographics.

The Company We Keep

Our Story

We are a boutique design & visualization shop with expertise in turning data into visual artifacts to support reasoning through complex systems and relationships. Our main keyword to remember us by is "data visualization", we do far more than that.

Finding insights you didn't even know existed

Data is everywhere, and on it's own doesn't have meaning. It requires interpretation and context for it to become more meaningful. One of the most impactful approaches to discover meaning from data is to play with visualization. Companies and individuals who can transform their data — and even their thoughts and ideas — into meaninful visual artifacts can improve their own decision-making, bring clarity to underlying problems, and develop an edge against their competitors who can't do this as efficiently.

Visualization, with a human touch

In our new world with AI and LLM tools, it's possible to go faster than ever in fully realizing and creating an idea. However, it is still insight and taste from human minds that turns any output into something truly meaningful and beautiful. Finding the right people to work with while leveraging new techniques, methodologies, and technology, while remaining open to learning can lead to a truly strong combination.

Our Services

How could we work together

Here are the main services we offer. If you don't see the exact thing you are looking for in here, don't hesitate to contact us and explain your precisely what you are looking for.

Data Visualization Apps

Websites (UI/UX)

Infographics

Interactive Pitchdecks

Report Templates

3D Graphics & Simulations

We work across a range of industries...

  • Healthcare
  • NGO
  • Fintech
  • Renewables
  • TechBio
  • Architecture

...and we know how to use a range of tools depending on the project

  • Python
  • Dash
  • Plotly
  • Claude Code
  • Blender
  • Figma
  • Final Cut Pro
  • Adobe Illustrator
  • Jupyter Notebooks
  • React
  • Javascript
  • Vim
  • Bash

Testimonials

What our clients think

With the clever algorithm and component Zyphr delivered, I feel like I finally have all the tools at my disposal to build exactly the app I need for the project at hand. I am still amazed at everything that has been done in such a short time.

Laurier Demers Engineer, Hydro-Québec

Zyphr worked with us to understand the kernel of the needed application, and aided in the brainstorming process to deliver a product which smartly used system constraints

Niall O'Dowd Ph.D CEO, Additive Monitoring Systems

It's not hyperbole to say that we would not be where we are as a company without Zyphr's support. Their thorough understanding of the platform is a key asset, but it's their obsessive attention to detail that sets them apart.

Kyle Owens CEO, TrendLine

Zyphr team has incredibly talented Python developers that can guide you and help you realize your product vision. It was their structured thinking that enabled us to develop scalable solutions much faster. In essense, Zyphr is a great find.

Nagarajan Sankrithi Ph.D CTO, Healthcare Integrative Solutions

Case Studies

Some of our Success Stories

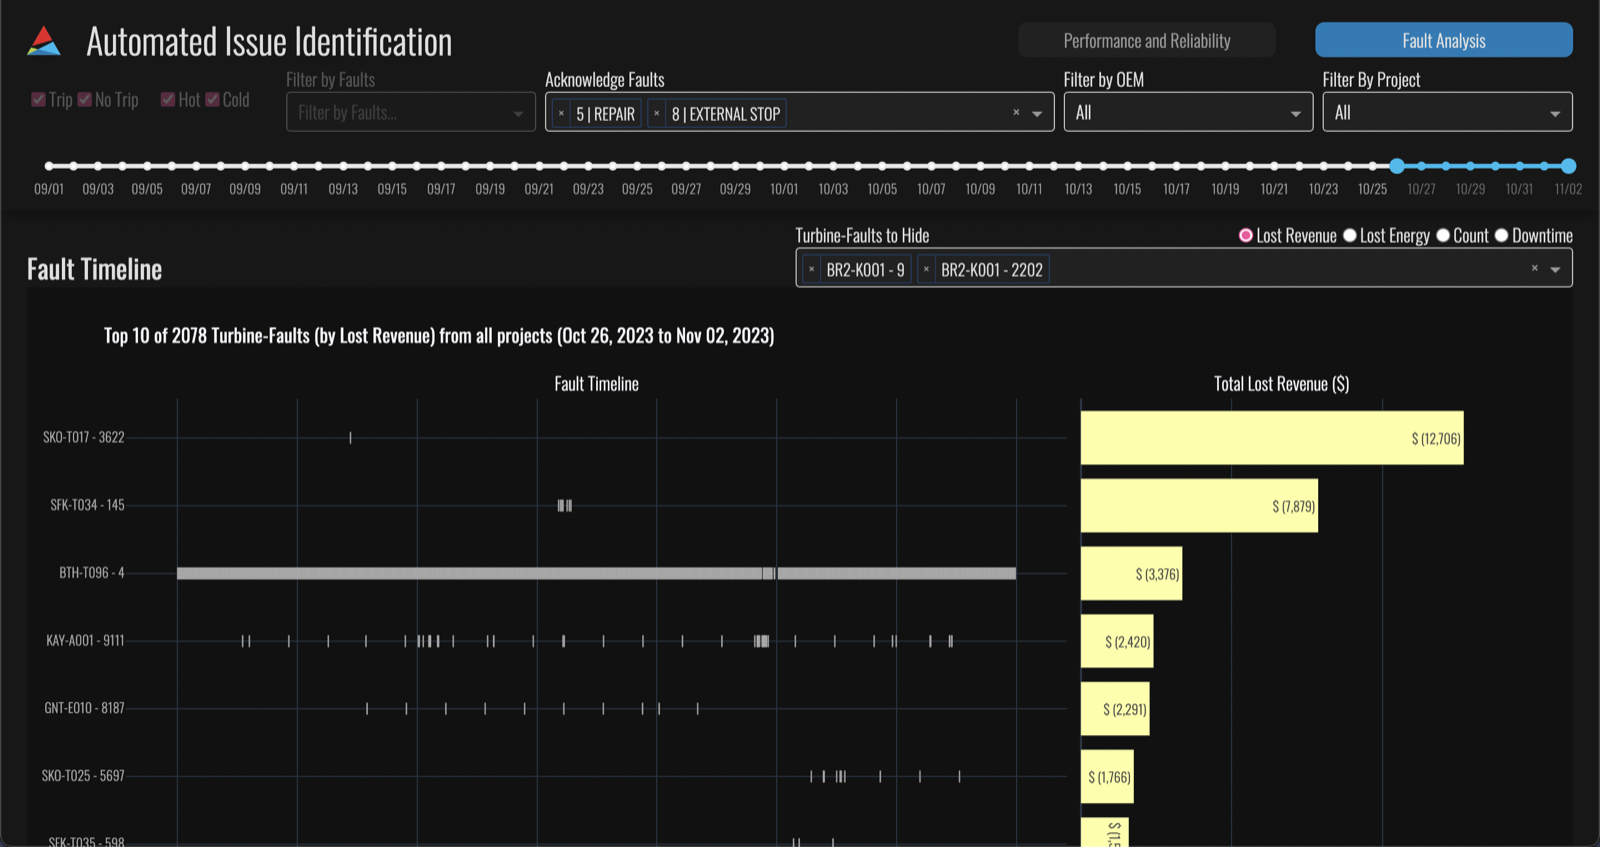
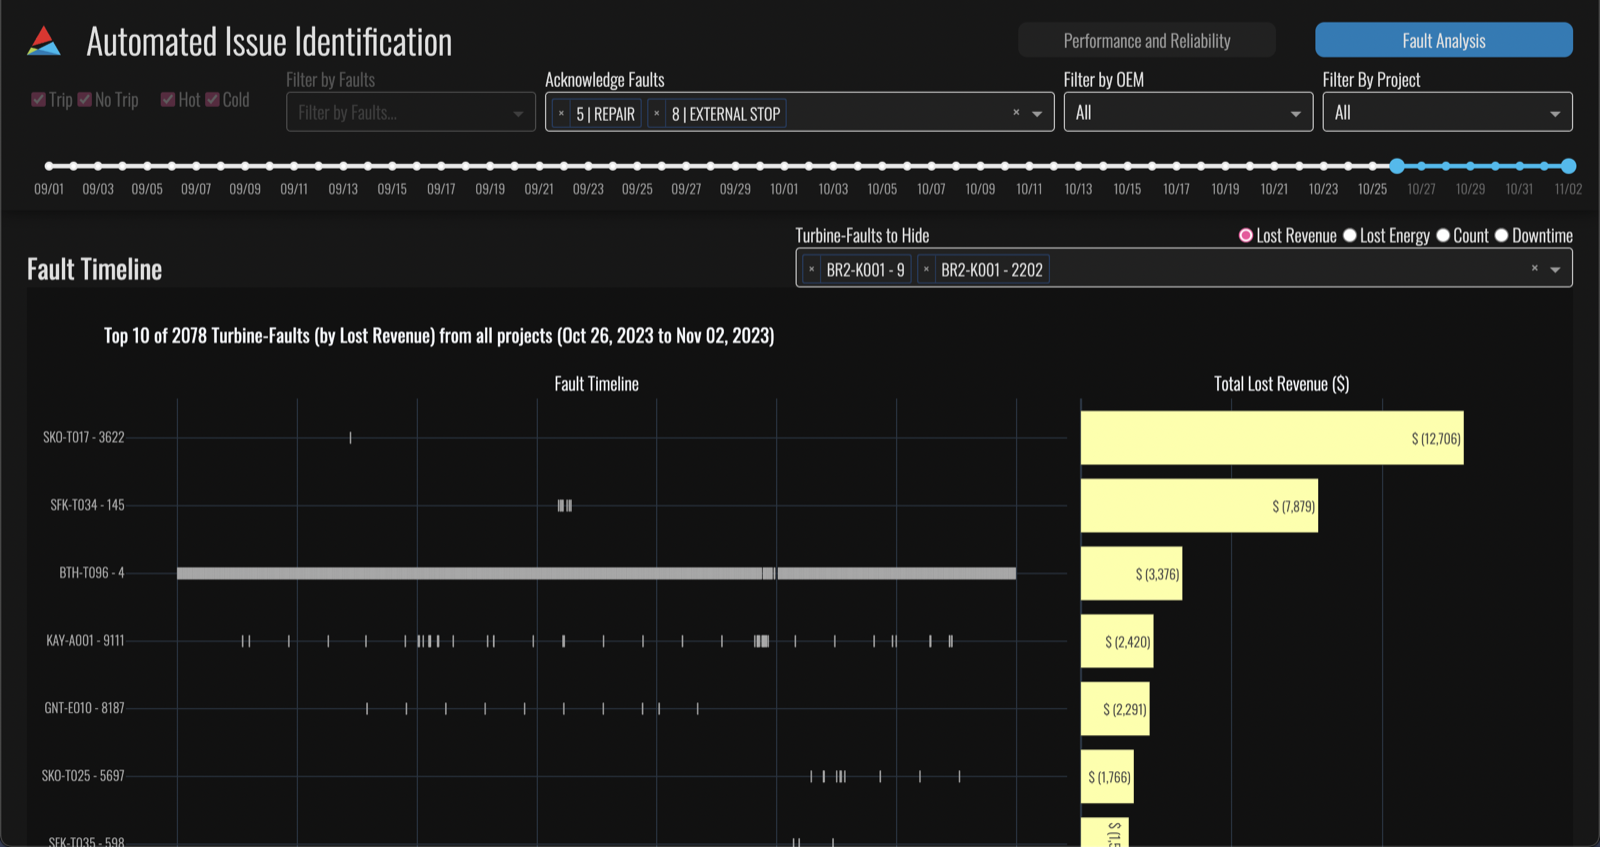
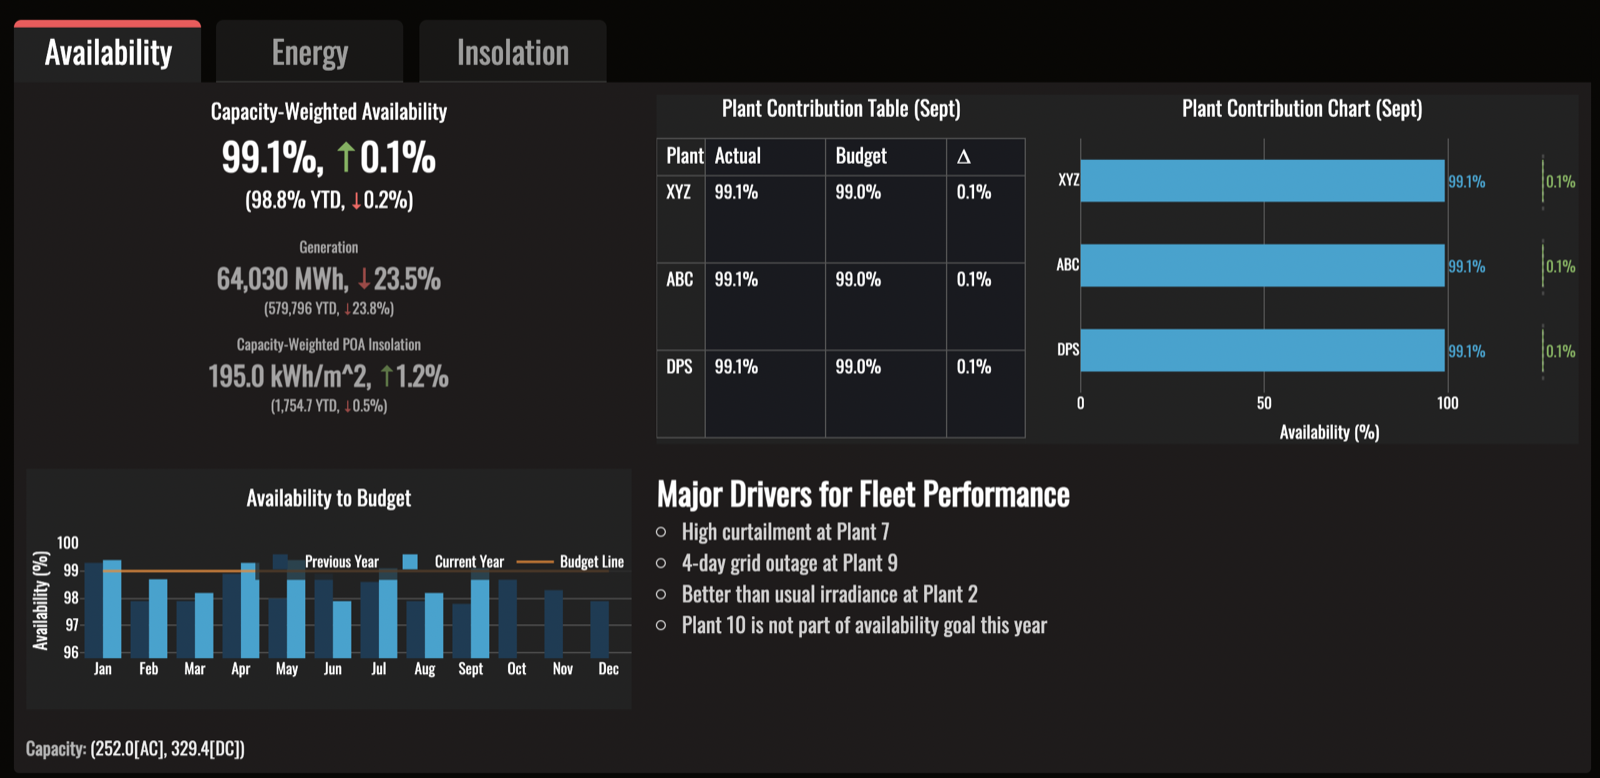
2026 Issue identification tool for wind and solar assets

Finding the worst actors across a wind/solar fleet

Site engineers had no clear view of where and why revenue was being lost across inverters, combiners, weather stations and turbines. We led the design, front-end build and project management of an internal diagnostic tool that has surfaced around $100,000 per year in issues and prompted 35+ reported performance issues and tickets.

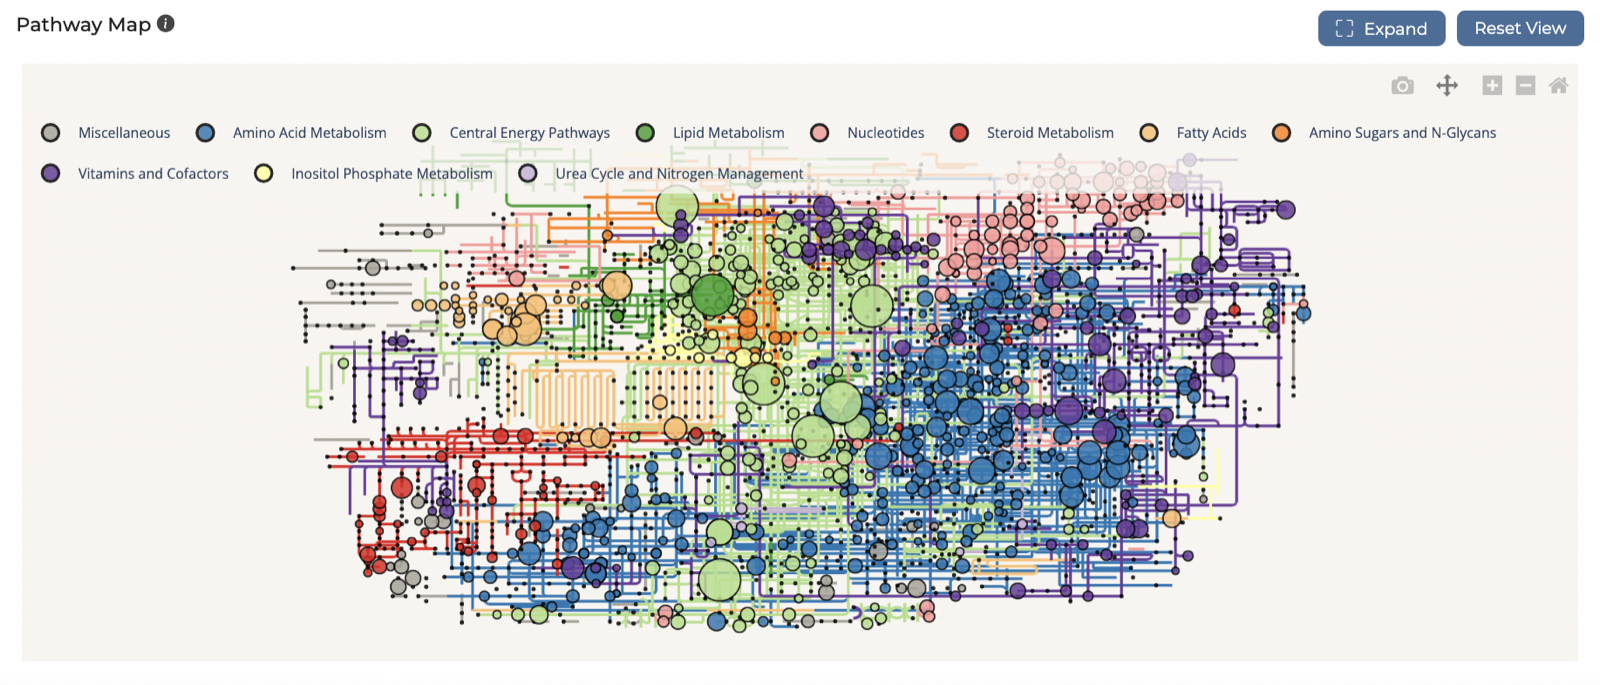
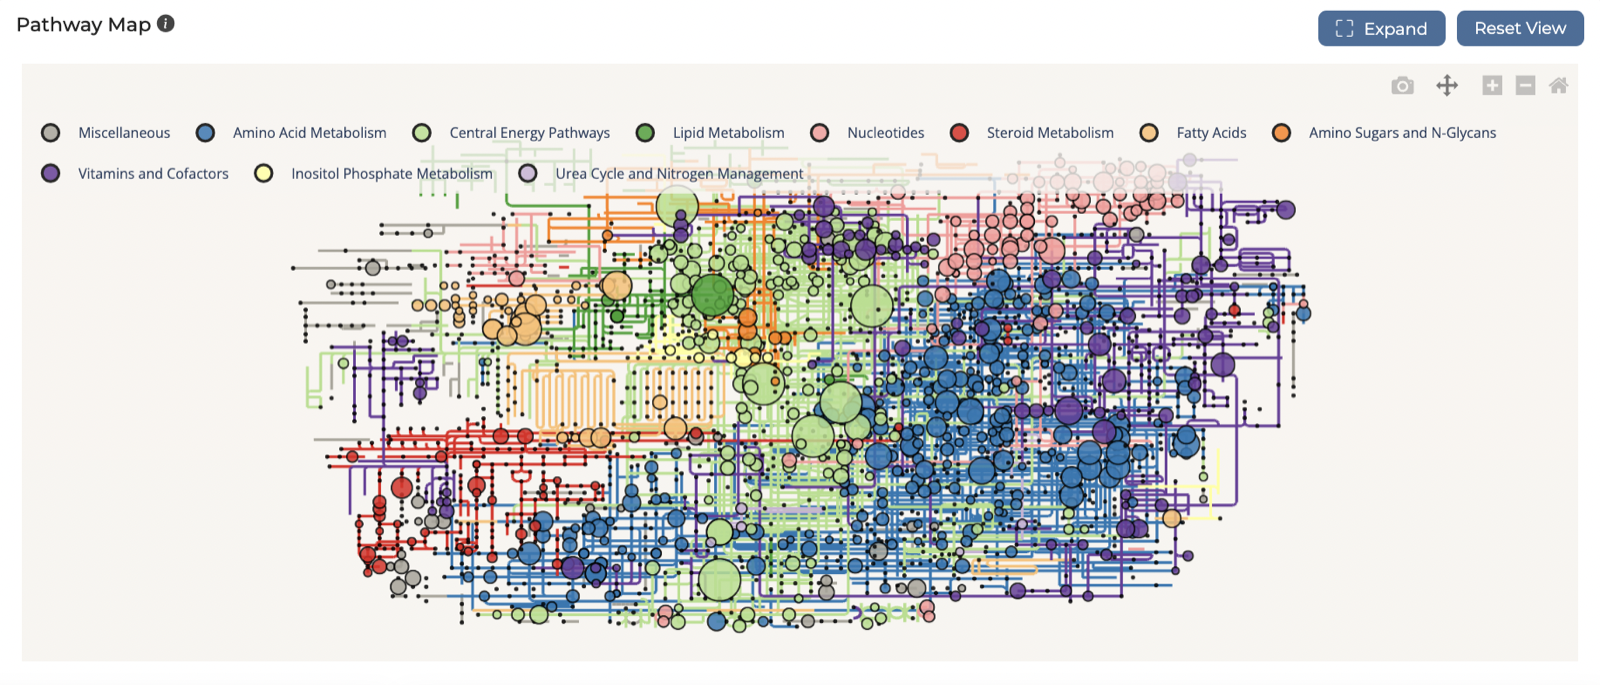
2023 Differential analysis tool for metabolomic data

Metabolomic scenarios for scientists and researchers

Researchers needed a way to run analyses on their metabolomic data. We designed and developed the Differential Analysis Tool, which is actively maintained and used by leading academic and BioPharma institutions, including multinational Pharma companies.

Adam Kulidjian

CEO

Hi, I'm Adam

I was the top contributor to the Plotly Python library during my years at Plotly between 2016 and 2019. I created key charts such as Sploms and Gantt charts to help the library hit more than 3 million downloads, and to date I am the #4 lifetime contributor to the Plotly Python library.

Kully

634 commits 696,923 ++ 292,766 --

This data displays commit history to the plotly.py library by Adam between Jan 2016 and Sept 2018. The data comes from GitHub.

Get in touch

If you're curious about seeing how we could work together, get in touch with Adam by either booking a discovery call or filling out the form below.

PS. If you just want to email, you can do that too at adam@zyphr.ca